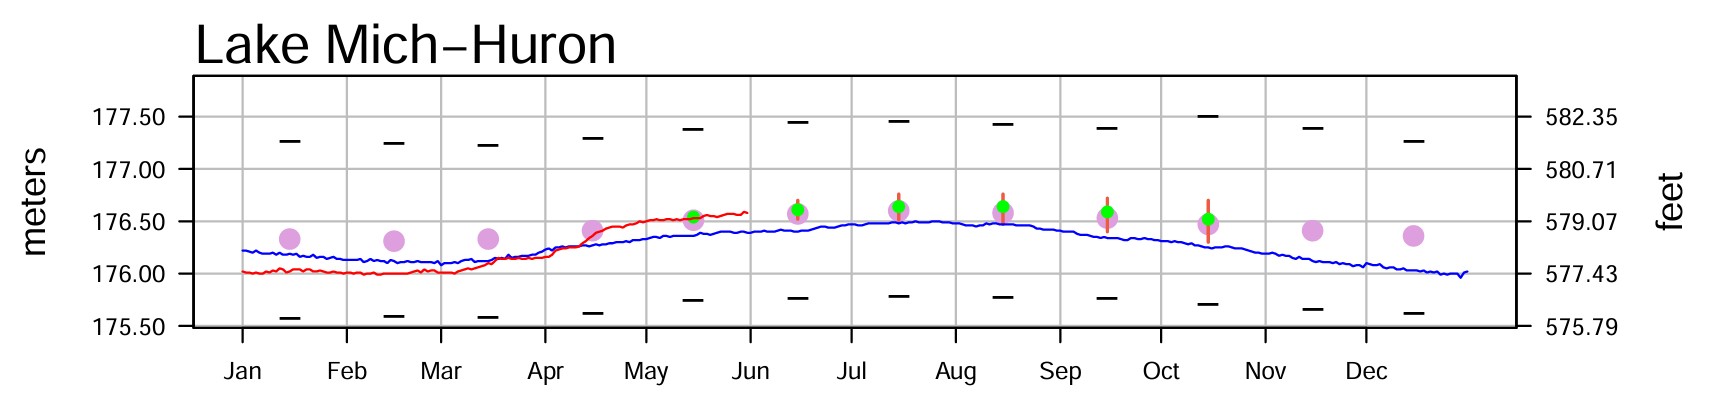
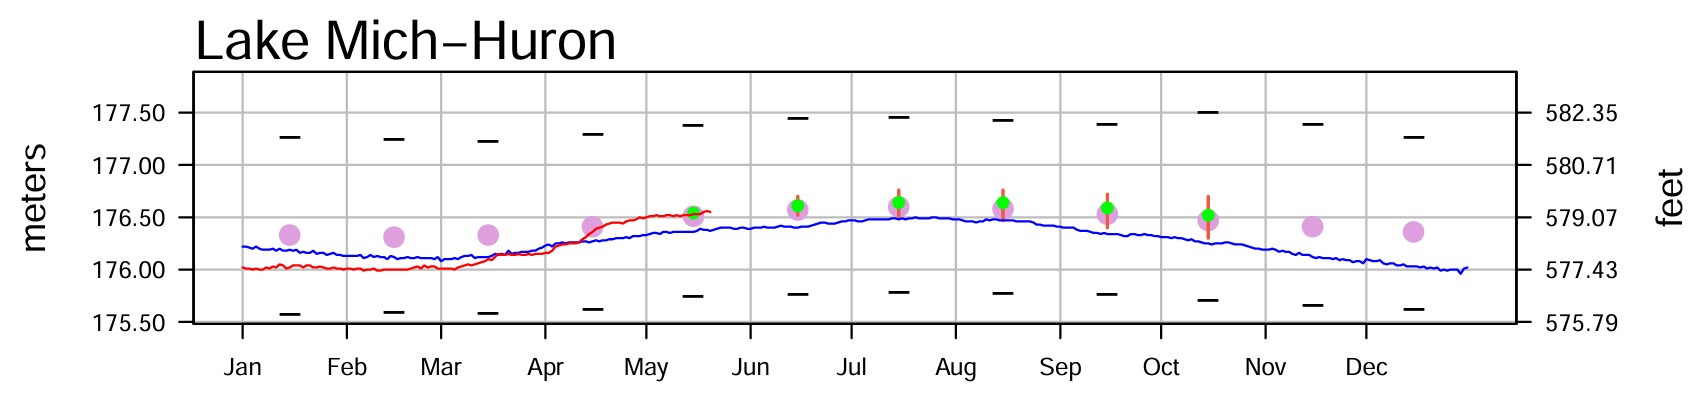
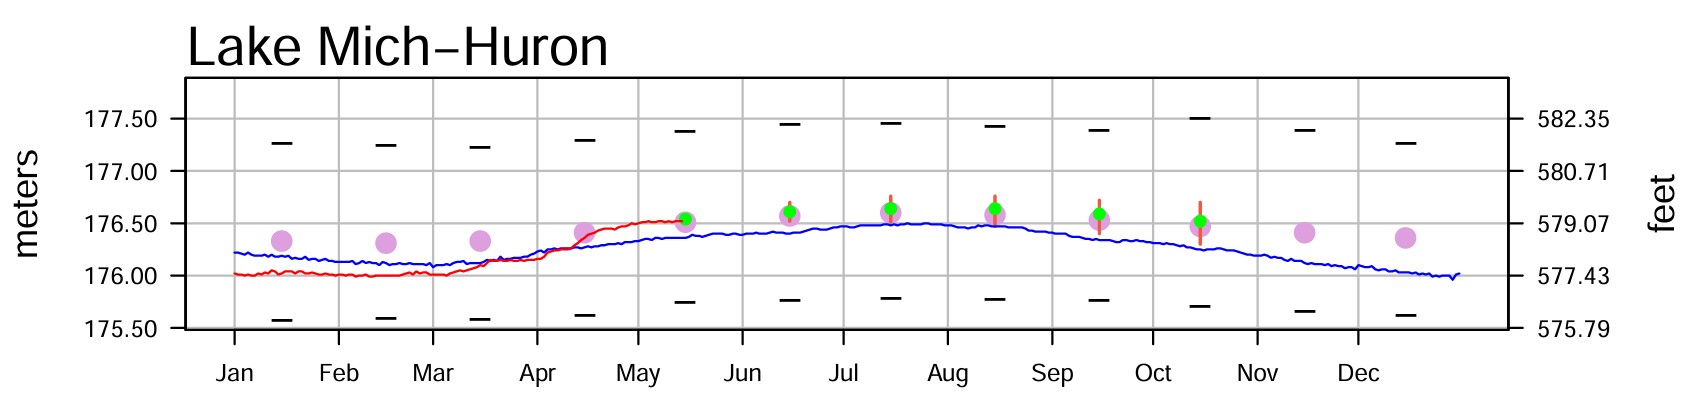
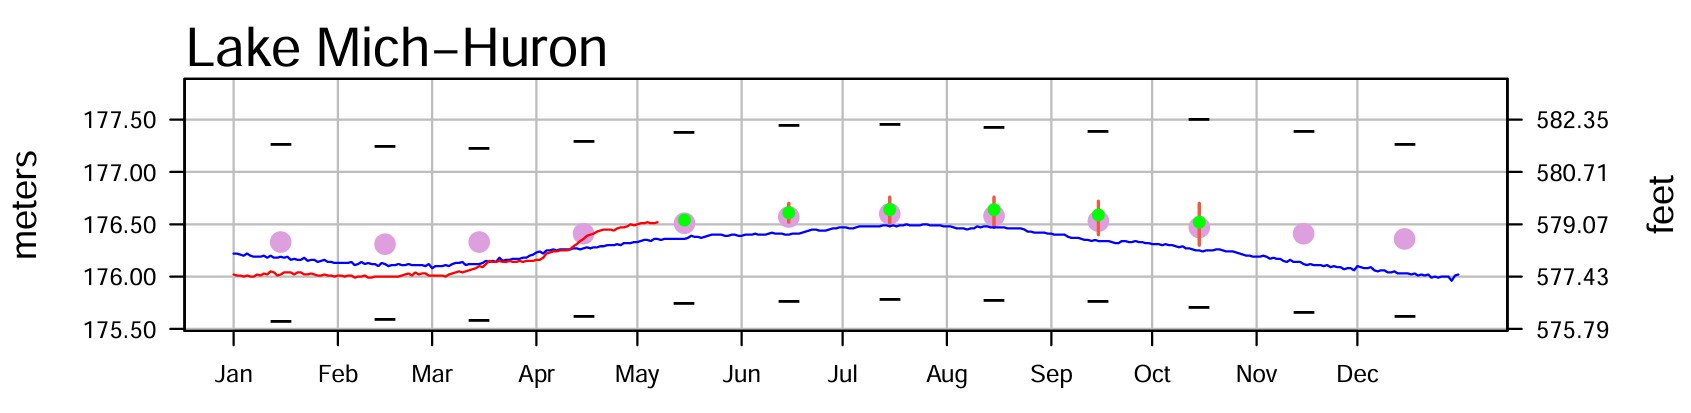
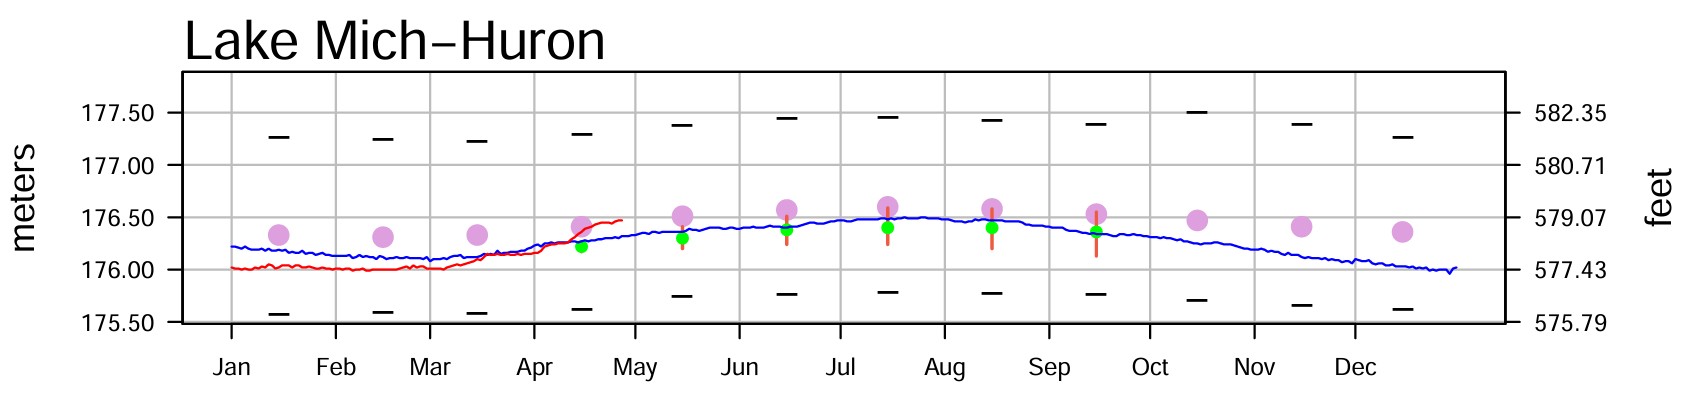
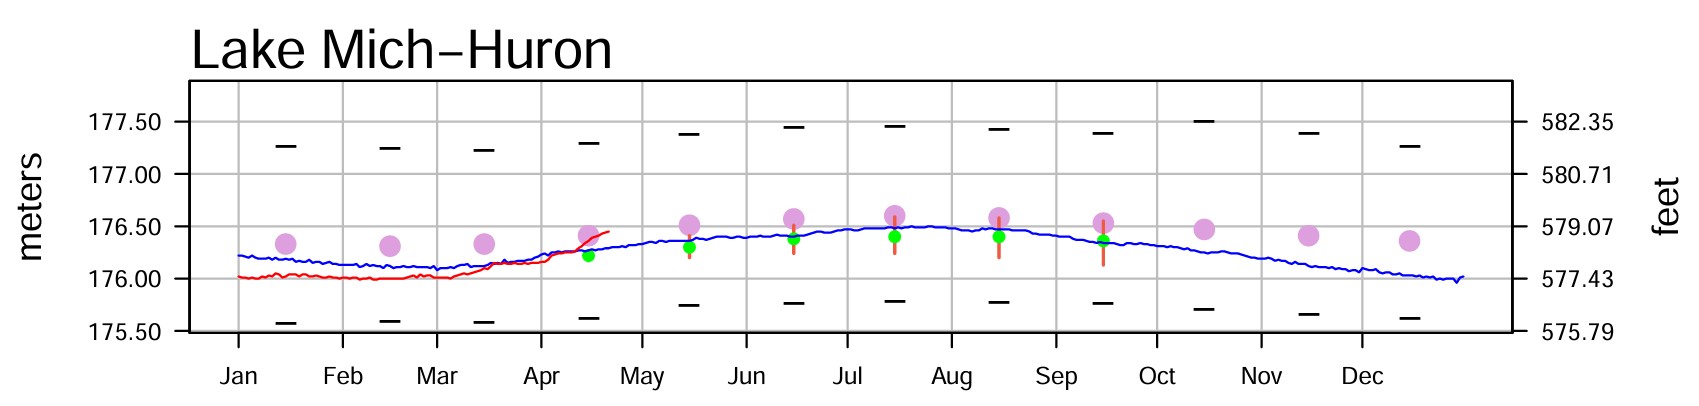
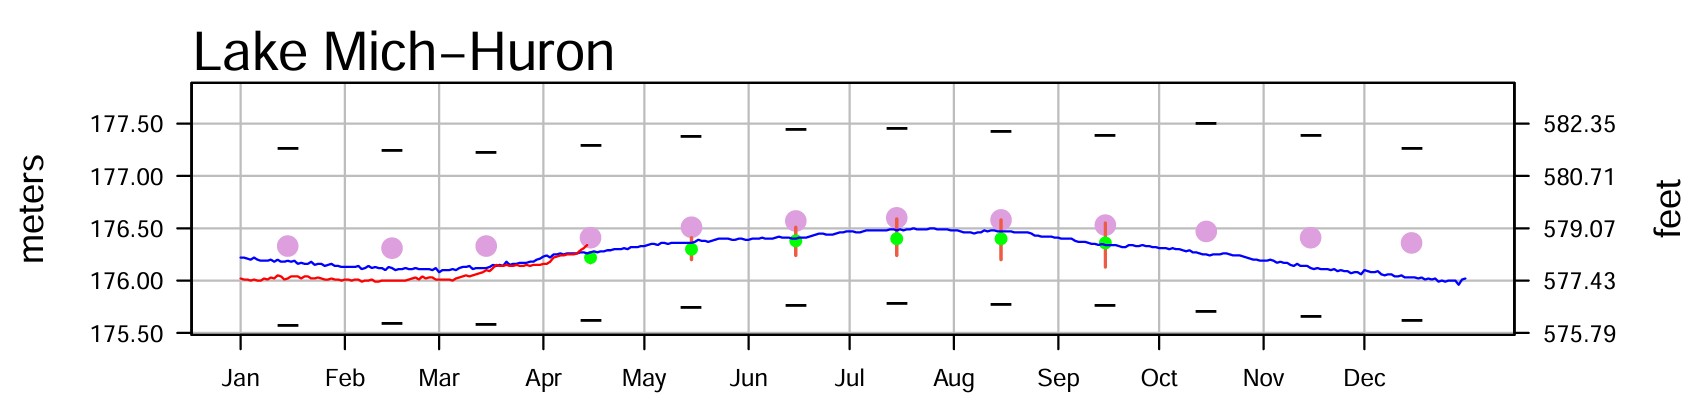
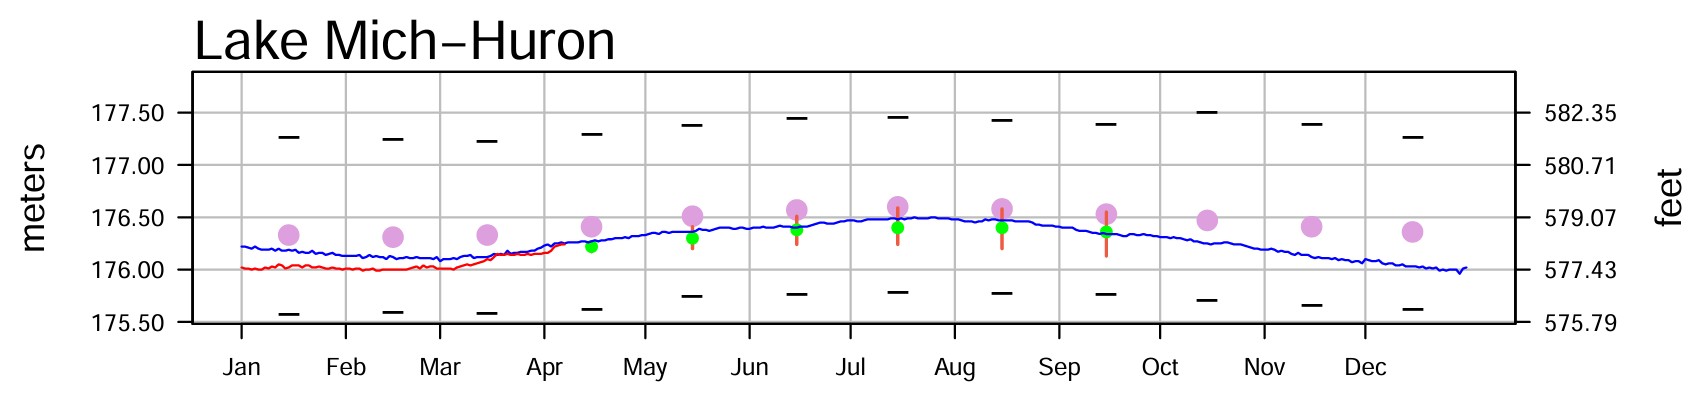
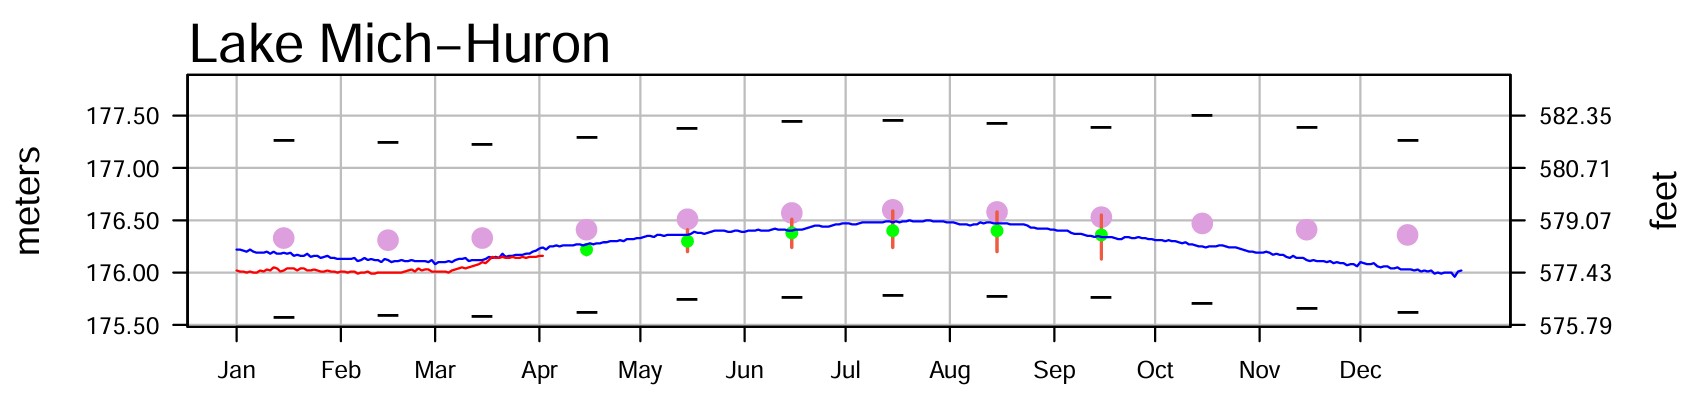
Lake Michigan-Huron is now 7 inches higher than it was at this time last year.


Lake Superior’s outflow through the St. Marys River is projected to be slightly above average in May. Lake Michigan-Huron’s outflow through the St. Clair River, Lake St. Clair’s outflow through the Detroit River, Lake Erie’s outflow through the Niagara River, and Lake Ontario’s outflow through the St. Lawrence River are projected to be above average in May.

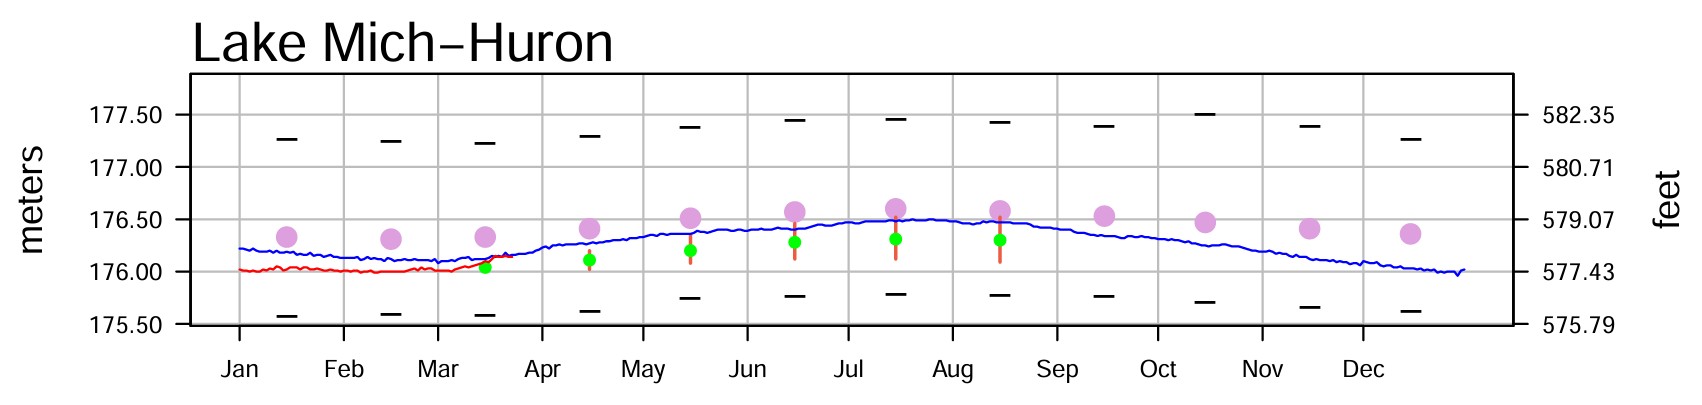
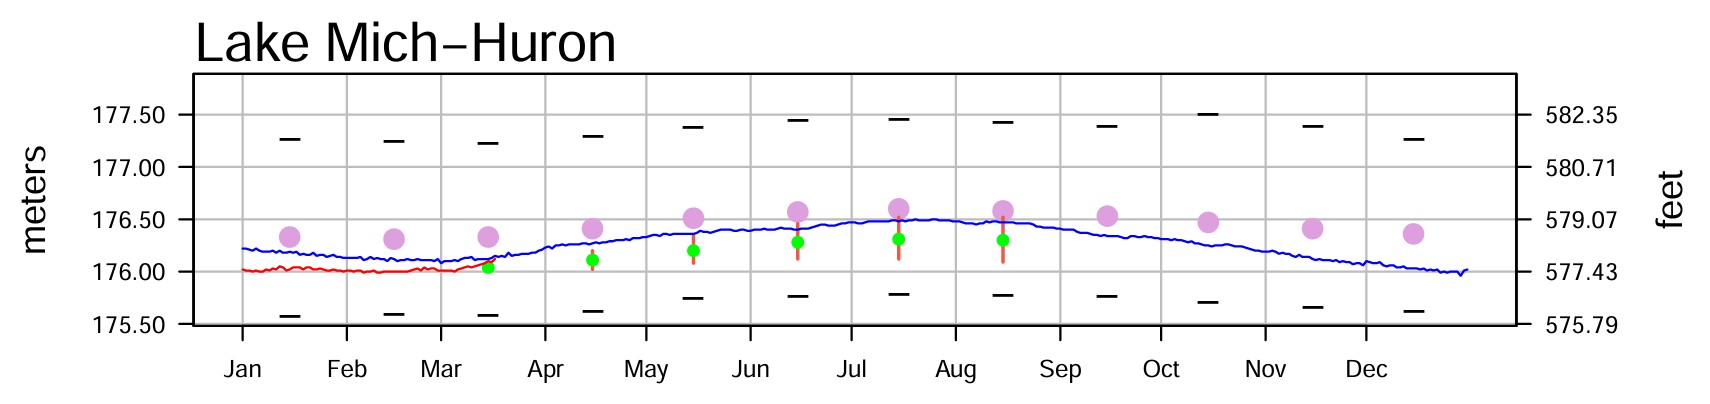
With regard to the forecast graph below, and the more recently updated first graph in this report, the USACE is predicting that the most likely outcome is that the Lake Michigan-Huron level will rise from March through July.
Monthly mean water levels for the previous year and the current year to date are shown as a solid line on the hydrographs. A projection for the next six months is given as a dashed line. This projection is based on the present condition of the lake basin and anticipated future weather. The shaded area shows a range of possible levels over the next six months dependent upon weather variations. Current and projected levels (solid and dashed lines) can be compared with the 1918-2021 average levels (dotted line) and extreme levels (shown as bars with their year of occurrence). The legend below further identifies the information on the hydrographs.